
History Graphs for ,
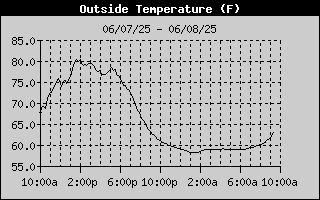
High Temperature
Low Temperature
87.3°F
52.7°F
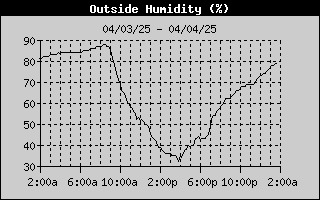

High Humidity
Low Humidity
86%
34 %
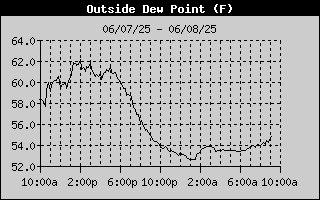
High Dewpoint
Low Dewpoint
63.0°F
47.0°F
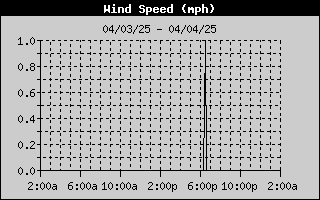
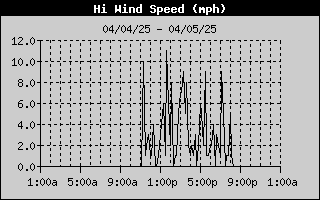
High Wind Speed
12.0 mph
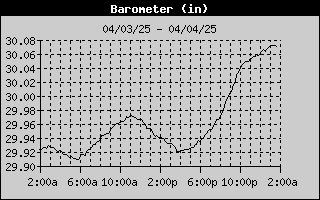
High Barometer
Low Barometer
29.966 in
29.759 in
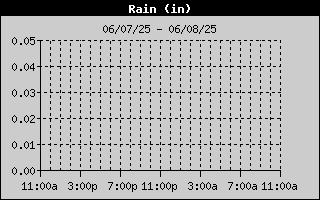
Rain Total
0.00 in
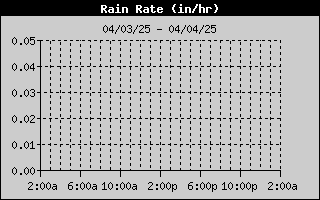
High Rain Rate
0.00 in/hr
Low Wind Chill
53.0°F
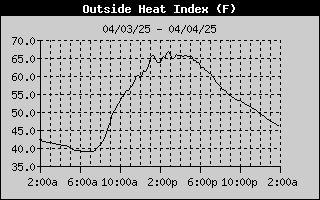
High Heat Index
87.0°F
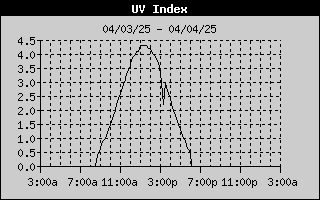
High UV
7.1 index
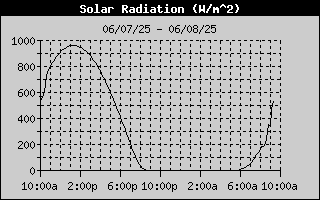
High Solar Radiation
1005 W/m²
High Temperature
Low Temperature
102.3°F
31.6°F
High Humidity
Low Humidity
94%
15%
High Dewpoint
Low Dewpoint
67.0°F
22.0°F
High Wind Speed
26.0 mph
High Barometer
Low Barometer
30.514 in
29.488 in
Rain Total
6.71 in
High Rain Rate
2.97 in/hr
Low Wind Chill
32.0°F
High Heat Index
107.0°F
High UV
7.3 index
High Solar Radiation
1281 W/m²